ABOUT ME:
Specializing in Data Visualization and infographics, my expertise lies in simplifying complex data for decision-makers through storytelling. As a Data Visualization Analyst at Bloomberg Industry Group, I used my analytical, artistic, and technical skills to produce graphics based on legislative, public policy, and economic data, collaborating closely with analysts and reporters in a fast-paced newsroom environment. Previously, I established a "Data Visualization Center" at DOT, where I produced social media infographics and collaborated with experts, contributing to proposals and marketing graphics. Proficient in industry-standard software and adaptable to dynamic environments, I continually seek to enhance skills and efficiency through technology.
CASE STUDIES
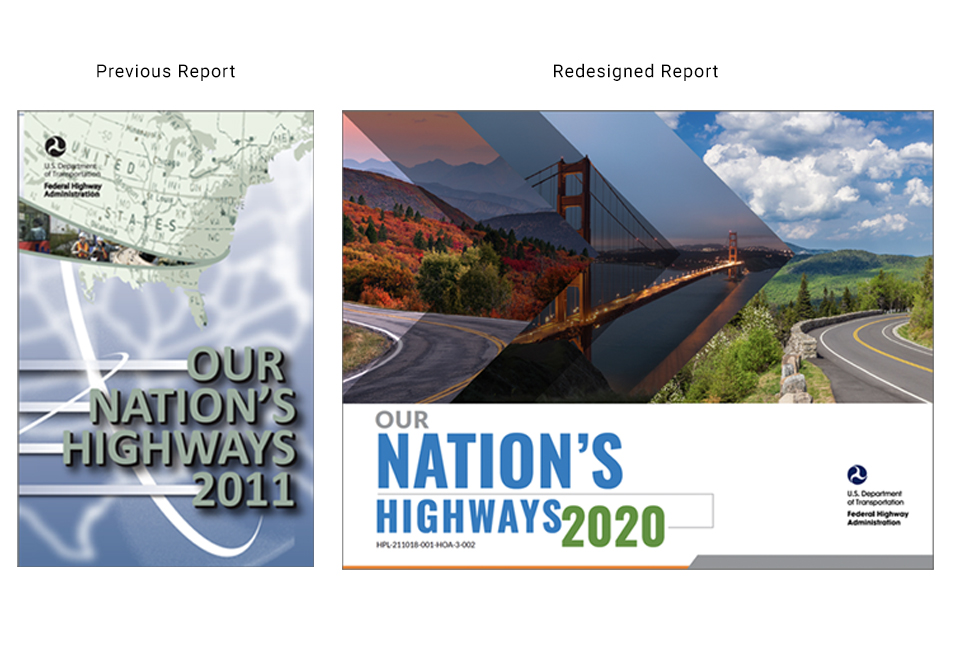
Our Nation's Highways
The report on the nation's highways has not been updated since 2011, rendering it outdated. The previous iteration underscored the critical importance of keeping information current. However, the prolonged absence of updates poses risks and challenges to effective highway management and planning. It's imperative to address this issue promptly to ensure accurate data for informed decision-making.
CHALLENGE:
• Notable issues with outdated data and significant gaps in information since 2011.
• Difficulty in data collection due to disparate formats and processes across states.
• Emphasizing the complexity of gathering updated data as a major hurdle.
SOLUTION:
• Implementation of a standardized data format for all new data entries.
• Streamlining data collection processes to ensure consistency across states.
• Proving the importance of uniformity in data formatting for easier analysis and updates.
Continue –>
Our Nation's Highways
IMPLEMENTATION:
• Adoption of a uniform data formatting system for all new data entries.
• Distribution of the new formatting guidelines to participating states.
• Collaboration with states to ensure adherence to the standardized format.
RESULTS:
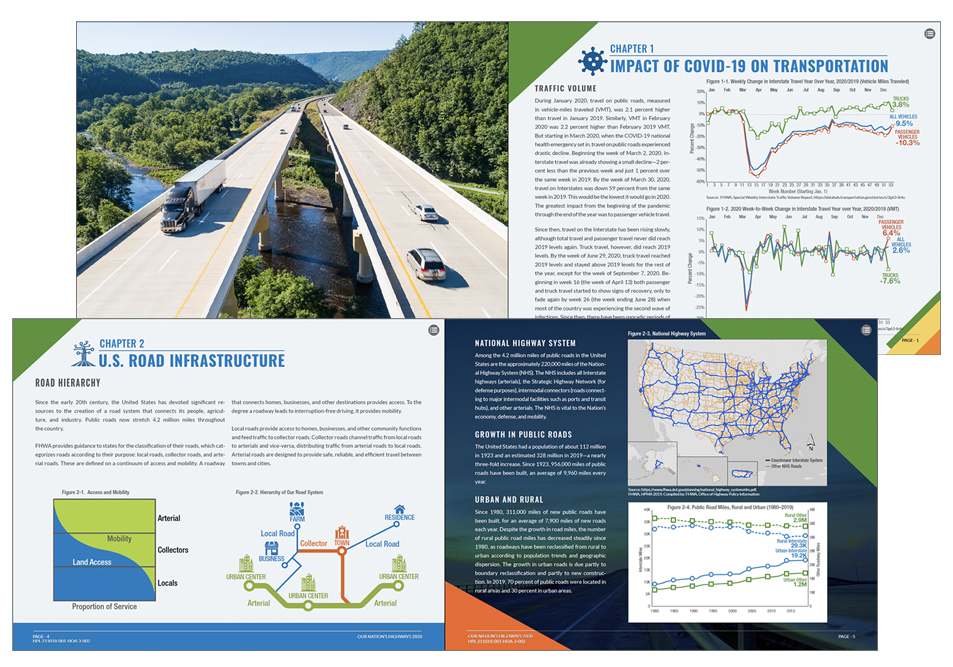
• Introduction of a clean and updated design utilizing data visualization for clarity.
• Enhanced accessibility and ease of use for analyzing for future reports.
• Improved efficiency in updating and maintaining data records for highways nationwide.
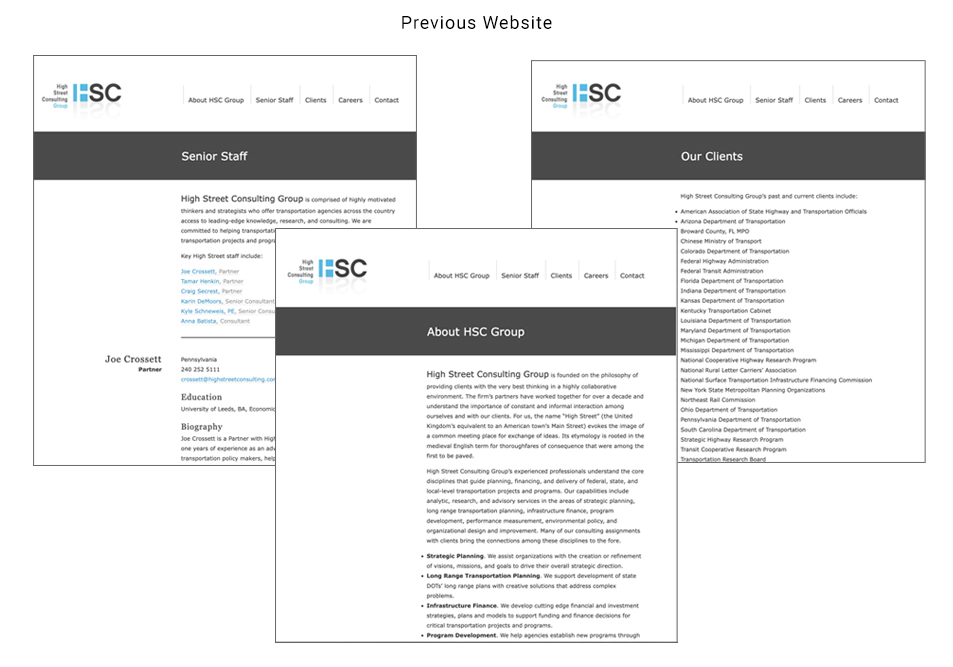
High Street Consulting
Website Redesign
CHALLENGE
• Importance of making a website dynamic and responsive in today's digital landscape.
• Impact of static content on user engagement and business growth.
• Need for a more interactive and user-friendly website to showcase the company's services effectively.
SOLUTION
• Approach taken to make the website dynamic and responsive.
• Utilization of modern web development technologies and frameworks.
• Creation of a responsive design that adapts to various devices and screen sizes.
• Introduction of interactive elements and multimedia content to enhance user experience.
• Addition of multiple sections highlighting the company's diverse range of services.
Continue –>
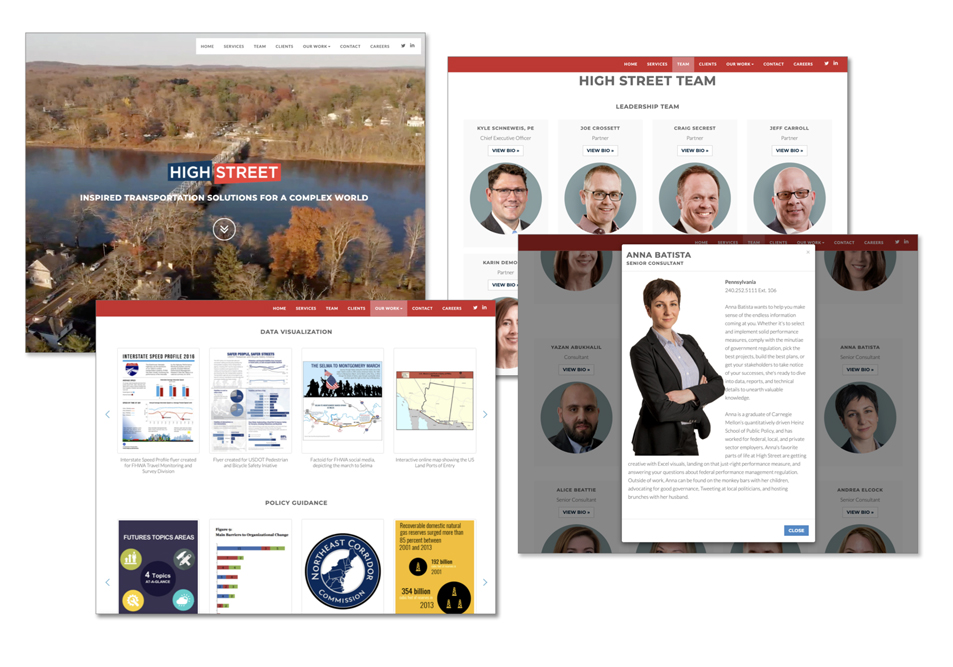
High Street Consulting
Website Redesign
https://highstreetconsulting.com/
IMPLEMENTATION
• Step-by-step process of transforming the static website into a dynamic one.
• Collaborated with videographer and content creators.
• Edited video drone footage for use on the home page
• Testing phase to ensure seamless functionality across different platforms and devices.
RESULTS
• Impactful, dynamic website increasing client engagement.
• Improvements in user interaction and time spent on the site.
• Increase in the number of proposal wins.
• Positive feedback from clients and users on the enhanced user experience.
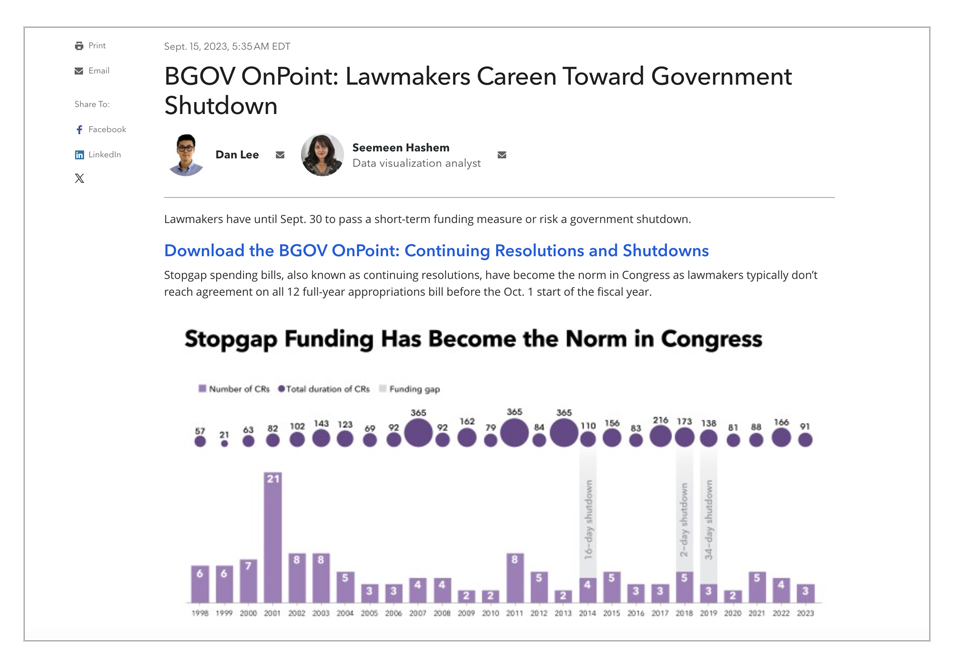
Data Visualization
Bloomberg Law
CHALLENGE:
Detailing the complexities of presenting disparate data points
1. Number of CRs (continuing resolutions).
2. Duration of CRs.
3. The funding gaps.
Highlighting the difficulty in showcasing the interconnectedness of these data points side by side for comprehensive analysis.
SOLUTION:
• Development of a unified chart that elegantly incorporates all three data points:
• Utilizing innovative design techniques to present data in a visually appealing and intuitive manner.
• Ensuring clarity and simplicity in the representation of complex information.
• Emphasizing the importance of creating a clean and cohesive visualization for optimal comprehension.
Continue –>
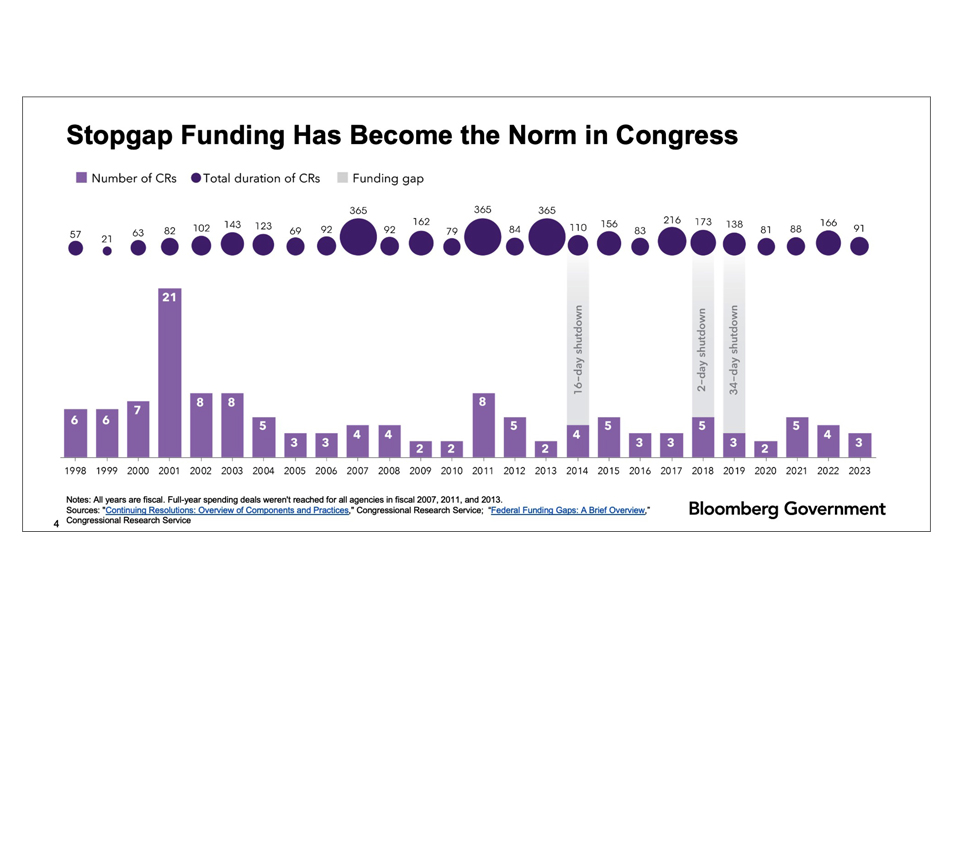
Data Visualization
Bloomberg Law
IMPLEMENTATION:
• Collaborated with legislative analysts to conceptualize and refine the chart design.
• Performed iterative testing and feedback processes to fine-tune the visual representation of data points.
RESULTS:
• Enhanced client engagement through the presentation of complex data in a clear and concise manner.
• Positive feedback from readers on the effectiveness of the data visualization in facilitating understanding and analysis of Stopgap spending bills.
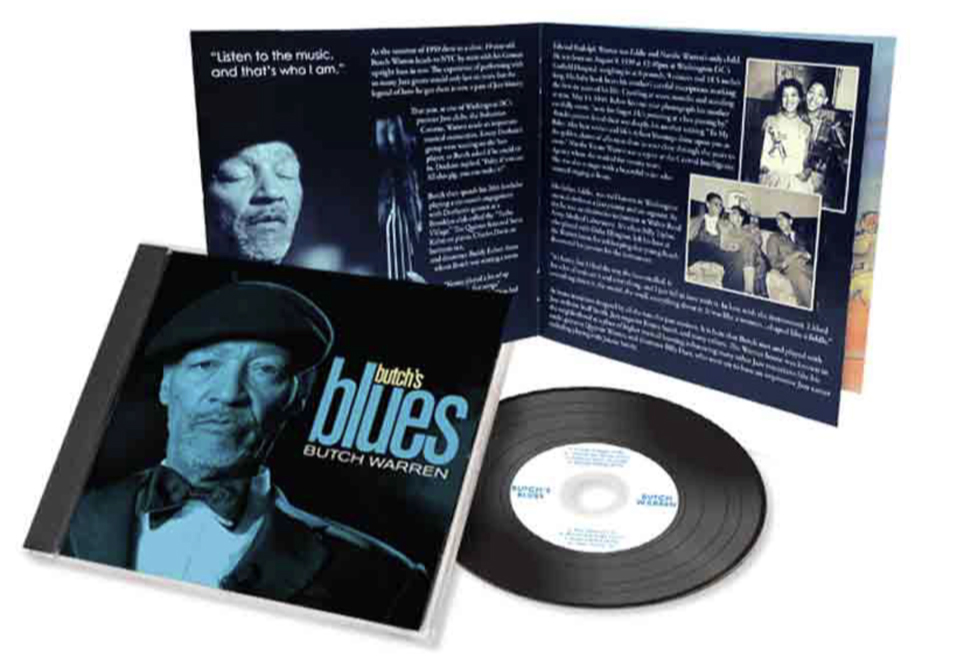
Butch Warren - CD Design
INTRODUCTION:
A renowned bass player for Blue Note Records in New York, he shaped the sound of albums by Dexter Gordon, Donald Byrd, Herbie Hancock, and Sonny Clark. Touring with Thelonious Monk in 1963-1964, he displayed promise as a disciple of Monk's innovative style. Despite musical success, he grappled with homelessness and hospitalization over four decades. Antoine Sanfuentes, an NBC News executive and friend, commissioned the design for Butch Warren's final album cover.
CHALLENGE:
The task was to sort through a vast collection of photographs to narrate Butch Warren's life story. The historical photos provided by his family and also images from Antoine, an excellent photographer, who chronicled Butch's comeback in his final years. Selecting just a few was challenging. The design had to be cohesive and integrate text within the limited space of the CD cover.
SOLUTION:
To address the challenge, the approach included giving the CD cover an old vintage Blue Note album appearance by applying a consistent duotone effect to all photographs, including the new photographs taken by Antoine. Collaboration with Antoine ensured that the text seamlessly complemented the chosen images, creating a cohesive design.